Marketing Reporting Is Broken: Why Your Data Never Answers the Only Question That Matters
Your marketing dashboard and analytics show every number except the one that matters — what to do next. How to turn reporting into decisions, and prove ROI.
Anshu Singla
Jun 18, 2026

It's 9 a.m. on
a Monday, and somewhere a marketing leader is staring at a dashboard, waiting
for an answer that isn't coming.
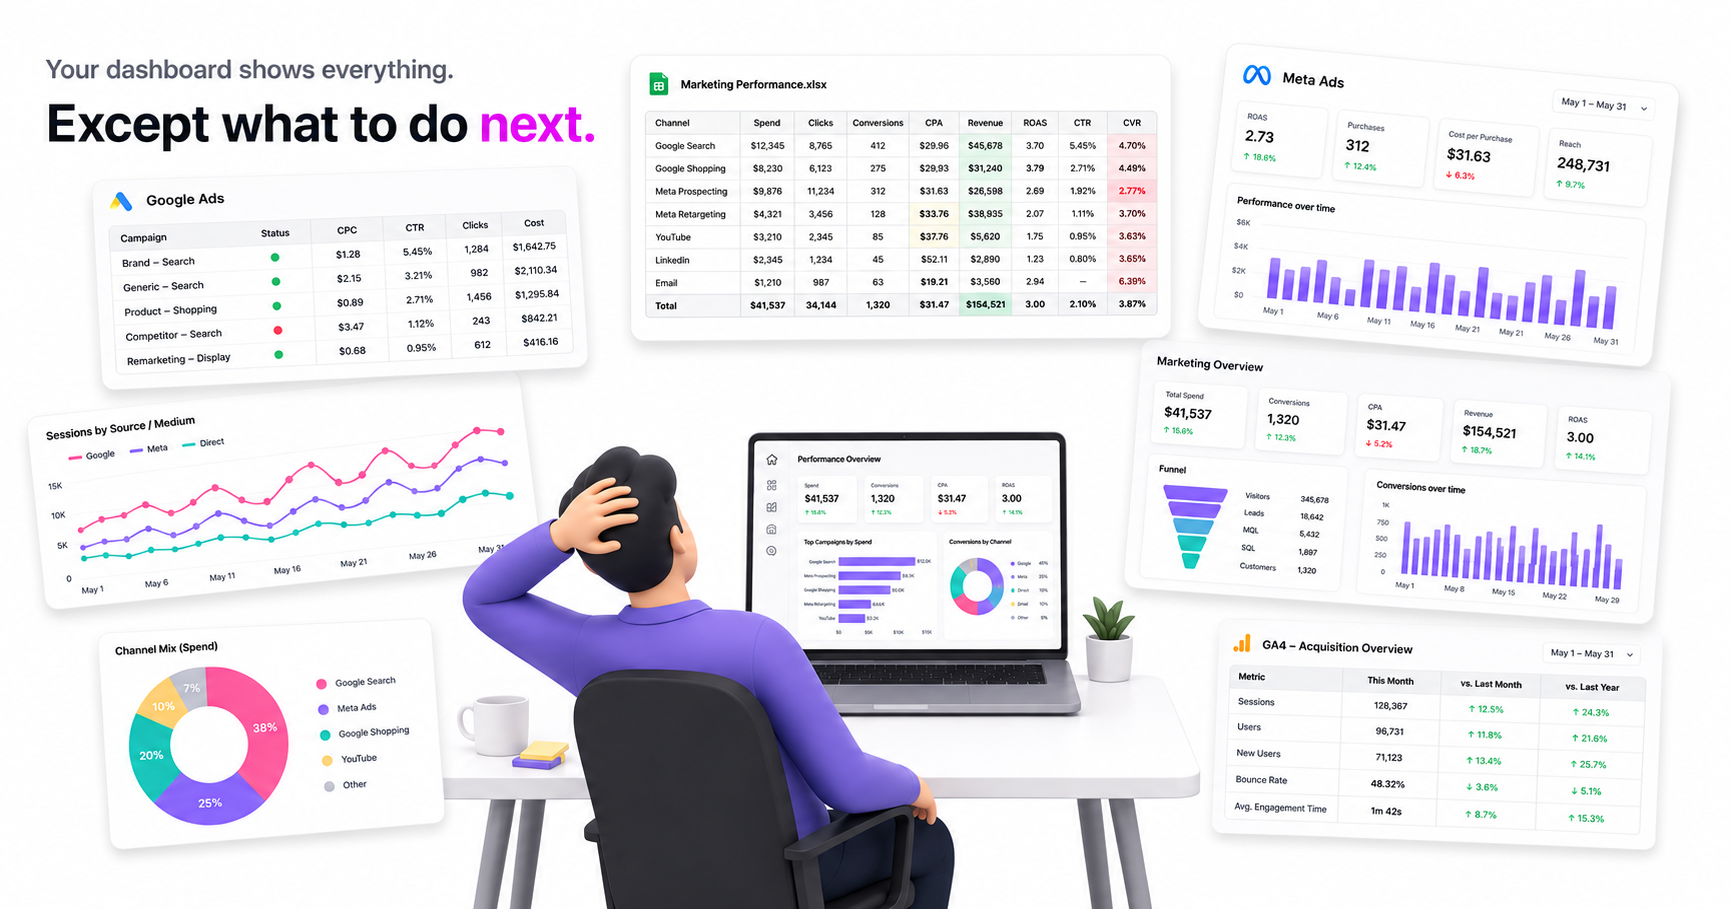
The numbers are
all there. Spend, clicks, conversions, ROAS, twelve tabs of it - and these
days, most of it pulled in automatically, refreshed overnight, sitting neatly
in one place. We solved the collection problem. What we didn't solve is the one
that actually matters: the data still doesn't tell you what to do.
Let me tell you
about a version of this person. Call him a growth head - the kind who has run
performance marketing at companies you'd recognize, managed budgets that would
make most people sweat, and still, every single week, ran into the same wall.
The Data Shows Up. The Direction
Doesn't.
His problem was
never access. The reports were automated, current, comprehensive. He could open
any screen and see everything.
That was
exactly the trouble. He had everything - and still couldn't see the one
thing he needed.
He could see
conversions were down four percent. He could see one channel was up and another
was flat. He could see cost per acquisition had crept the wrong way. What he couldn't
see - anywhere, in any of it - was what to do about it. The dashboards were
fluent in what happened and completely silent on what now.
Performance was
down, fine. But because of which campaign? Which creative had quietly stopped
pulling its weight? Which audience was the engine, and which was dead weight he
was still paying for? The data described the symptom in beautiful, automated
detail and never once named the cause.
So he'd do what
every good operator does: dig. Export to a spreadsheet, cross-reference,
eyeball patterns across rows until something clicked. Hours of detective work,
every week, just to translate numbers he already had into a decision
he could act on. The modern reporting stack had nailed the easy 80 percent - collecting and displaying the data - and left him the hard, decisive 20
percent that actually moved the business.
He knew,
broadly, what was working and what wasn't. He just never knew exactly what
needed to be done. And "broadly" doesn't help you when you're
about to reallocate a month's budget.
The Two Gaps Nobody's Reporting
Closes
Strip it all
down, and his frustration lived in two gaps the dashboards never bridged.
.png)
The first is data
to insight. A number is not an insight. "Conversions down 4%" is
a fact. "Conversions are down because your best-performing creative has
fatigued and your two prospecting campaigns are now bidding against each other
for the same audience" - that's an insight. The first you can read
off a screen. The second requires connecting signals across campaigns,
creatives, audiences, and time, all at once - which is exactly the work that
gets dumped on a human at 11 p.m.
The second is insight
to action. Even once you've found the insight, knowing matters far less
than knowing what to do next. Pause it? Reallocate to where? By how
much? The gap between a sharp observation and a confident next move is where
most reporting simply shrugs and leaves you on your own.
Those two gaps - data to insight, insight to action - are the entire job. And they're the
exact part the tooling quietly hands back to you.
The CEO Meeting, and the Three
Words He Hated Saying
The hardest
moment came when he had to present.
He'd walk into
the CEO's office with the story he could tell - the parts of the data he'd
personally managed to connect. "Here's what's up, here's what's down,
here's where we're putting money." For a few minutes, it would go fine.
And then the
CEO would start asking the real questions. Not the ones the dashboard
was built to answer. Why is acquisition cost rising if the campaigns look
healthy? Are we paying twice to reach the same customer? How much of last
month's budget actually produced anything? If we put another ten lakh in, where
exactly does it go, and what comes back?
Good questions. The questions a CEO is supposed to ask. And the honest answer to most of them was the same three words he'd grown to dread: "Let me come back to you."

Not because he wasn't good at his job - he was excellent at it. But because the answers lived in connections no single report surfaced, in patterns buried one level below anything his tools showed him. He'd leave the room, spend another two days digging, and return with answers to questions the business had already moved past.
That gap - between the picture you can confidently present and the questions leadership
actually asks - is where credibility quietly erodes. Not in a dramatic failure.
In a hundred small "let me come back to you"s.
The Insights That Hide in the
Distance
Here's what
took him years to name: the most valuable insights are exactly the ones that
the distance between data and decision keeps hidden.
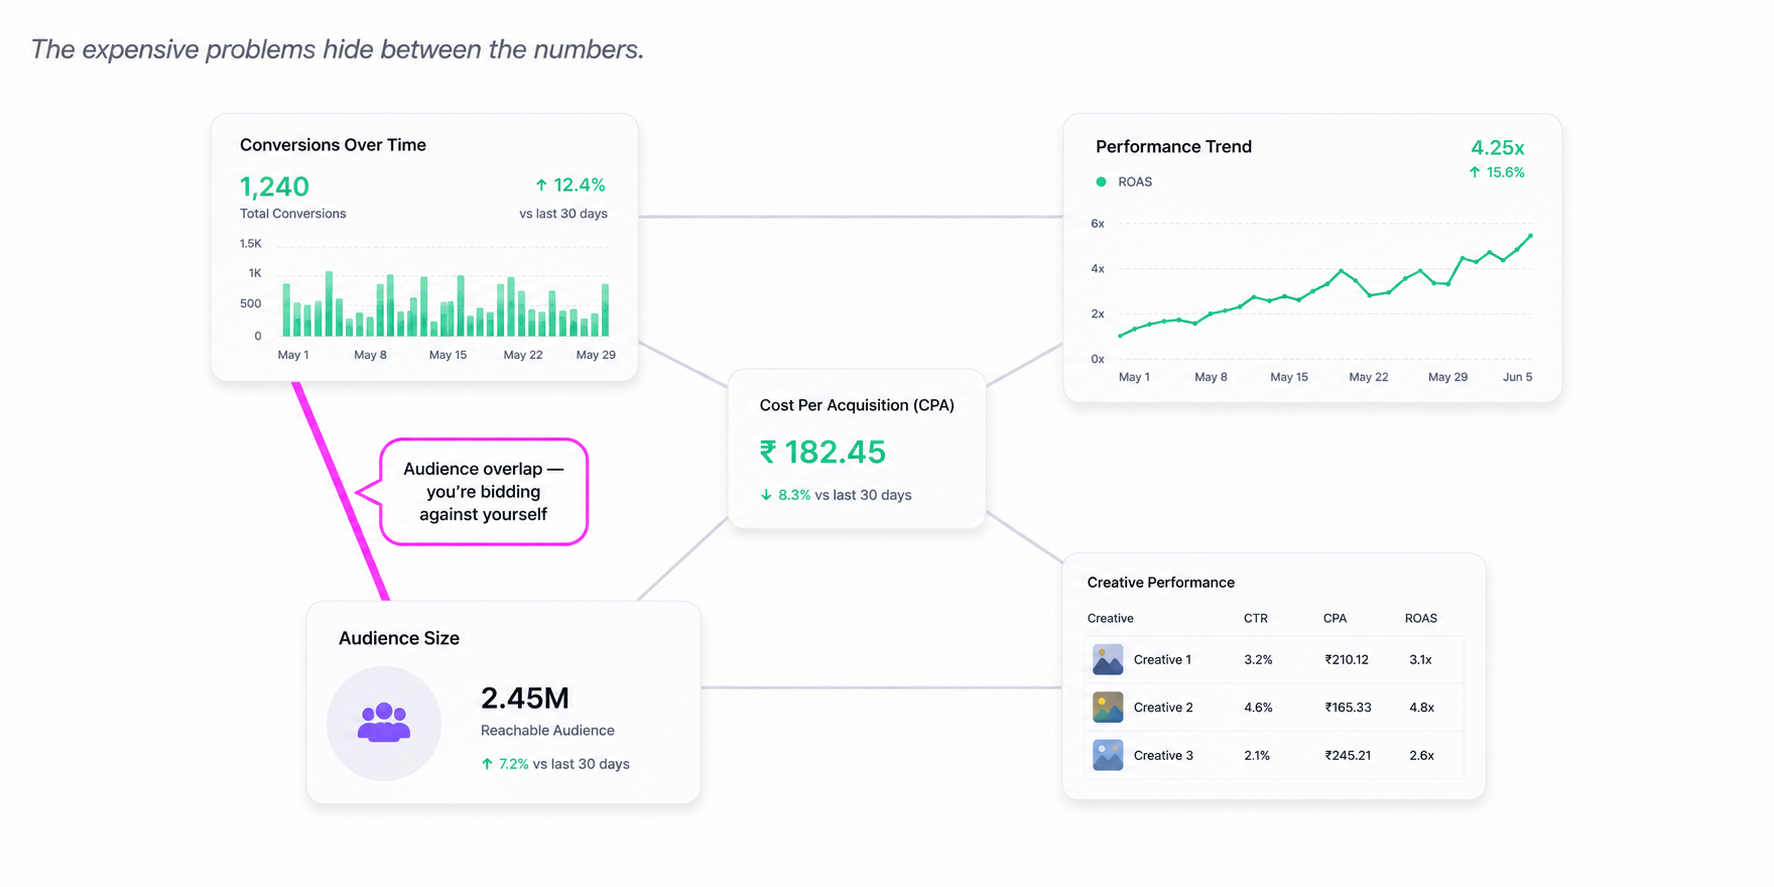
The creative
that's silently fatiguing while the dashboard still shows it green. The two
campaigns quietly bidding against each other for the same person, inflating
your own costs. The budget still flowing to something that stopped working
weeks ago. None of those show up as a flashing red number. They live in the
connections between the numbers - which is precisely the part automated
reporting collects but never interprets.
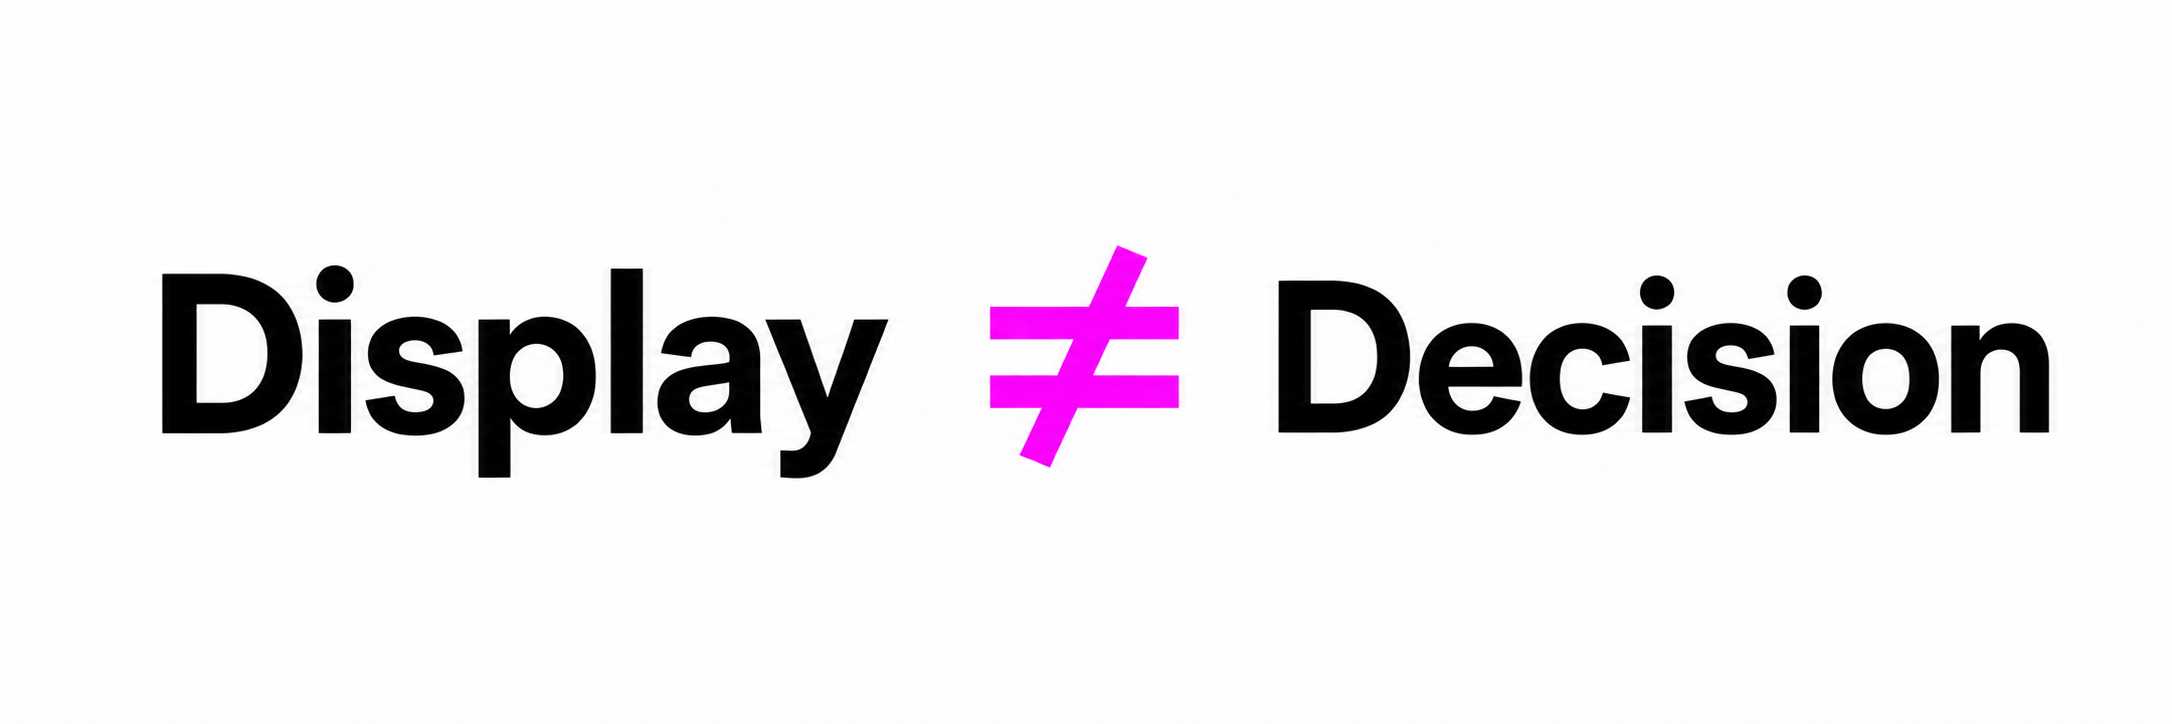
That's the
difference between a tool that reports your marketing and one that
actually helps you run it. One hands you the pile. The other hands you
the decision.
This Is Exactly Why We Built
Hawkeye
Hawkeye exists
to close those two gaps - data to insight, and insight to action - so the dig
at 11 p.m. and the "let me come back to you" both disappear.
It sits above
all your platforms and gives you one unbiased view, then does the part every
other tool stops short of: it reads the connections for you. It surfaces the
creative that's fatiguing before performance collapses, flags the audiences
overlapping and bidding against each other, and shows you exactly where budget
is leaking into assets that have stopped earning. Every insight arrives with
the next move attached - not just what's happening, but what to do
about it.
And it speaks
at every altitude. A top-level summary when the CEO wants the five numbers that
matter. A managerial view when you need to drill into campaign, creative, geo,
or audience. And the deep, easy-to-miss insights underneath - the ones that
used to cost you two days and a spreadsheet - surfaced in a single click.
So the next
time you walk into that meeting, you don't reach for a spreadsheet. You turn
the screen. When they ask where the money went, you know. When they ask if
you're paying twice for the same customer, you already know. When they ask what
another ten lakh buys, you have the answer before they've finished the
sentence. The meeting stops being a quiz you're underprepared for and becomes a
conversation you're leading.
The data was never
the problem. The distance was. Hawkeye closes it.
FAQ
Why doesn’t my marketing dashboard tell me what to do?
Collection is a
solved problem - most dashboards pull and refresh data automatically. The
failure is that they stop at display. They’re fluent in what happened and
silent on why and what to do next, leaving the hardest, most valuable work to a
human and a spreadsheet.
What’s the difference between data, insight, and action?
Data is a fact:
‘conversions are down 4%.’ Insight is the connected cause: ‘because your best
creative fatigued and two campaigns are bidding against each other.’ Action is
the decision: what to pause, where to reallocate, and by how much. Most
reporting hands you the first and abandons you before the third.
What’s the difference between a marketing dashboard and a report?
A dashboard is
a live, at-a-glance view of your metrics; a report is a periodic, packaged
summary. Both are ways of displaying data - and neither, on its own, tells you
which decision to make. That last step needs an insights layer that reads
across the numbers for you.
How do I prove marketing ROI to my CEO?
The tough
questions - why is acquisition cost rising, are we paying twice for the same
customer, what does more budget return - live in connections no single report
surfaces. You need an insights layer across spend, creative, audience, and
efficiency so you can answer in the room instead of saying ‘let me come back to
you.’
What insights do marketing dashboards usually miss?
The expensive
ones hide between the numbers: creative fatigue while an ad still looks green,
audience overlap inflating your own costs, and budget still flowing to assets
that stopped working weeks ago. None show up as one red metric, so manual
review almost always misses them.
What is Hawkeye and how does it help?
Hawkeye sits
above all your ad platforms and gives you one unbiased view - then closes the
gaps from data to insight to action. It surfaces fatigue, overlap, and wasted
spend, attaches a recommended next move to every insight, and speaks at
executive, managerial, and granular levels in a single click.
Share this article